 AssayPlot
AssayPlot
AssayPlot
Free and open source, for people who would rather not write code. Runs on your machine — no account, no cloud, no subscription.





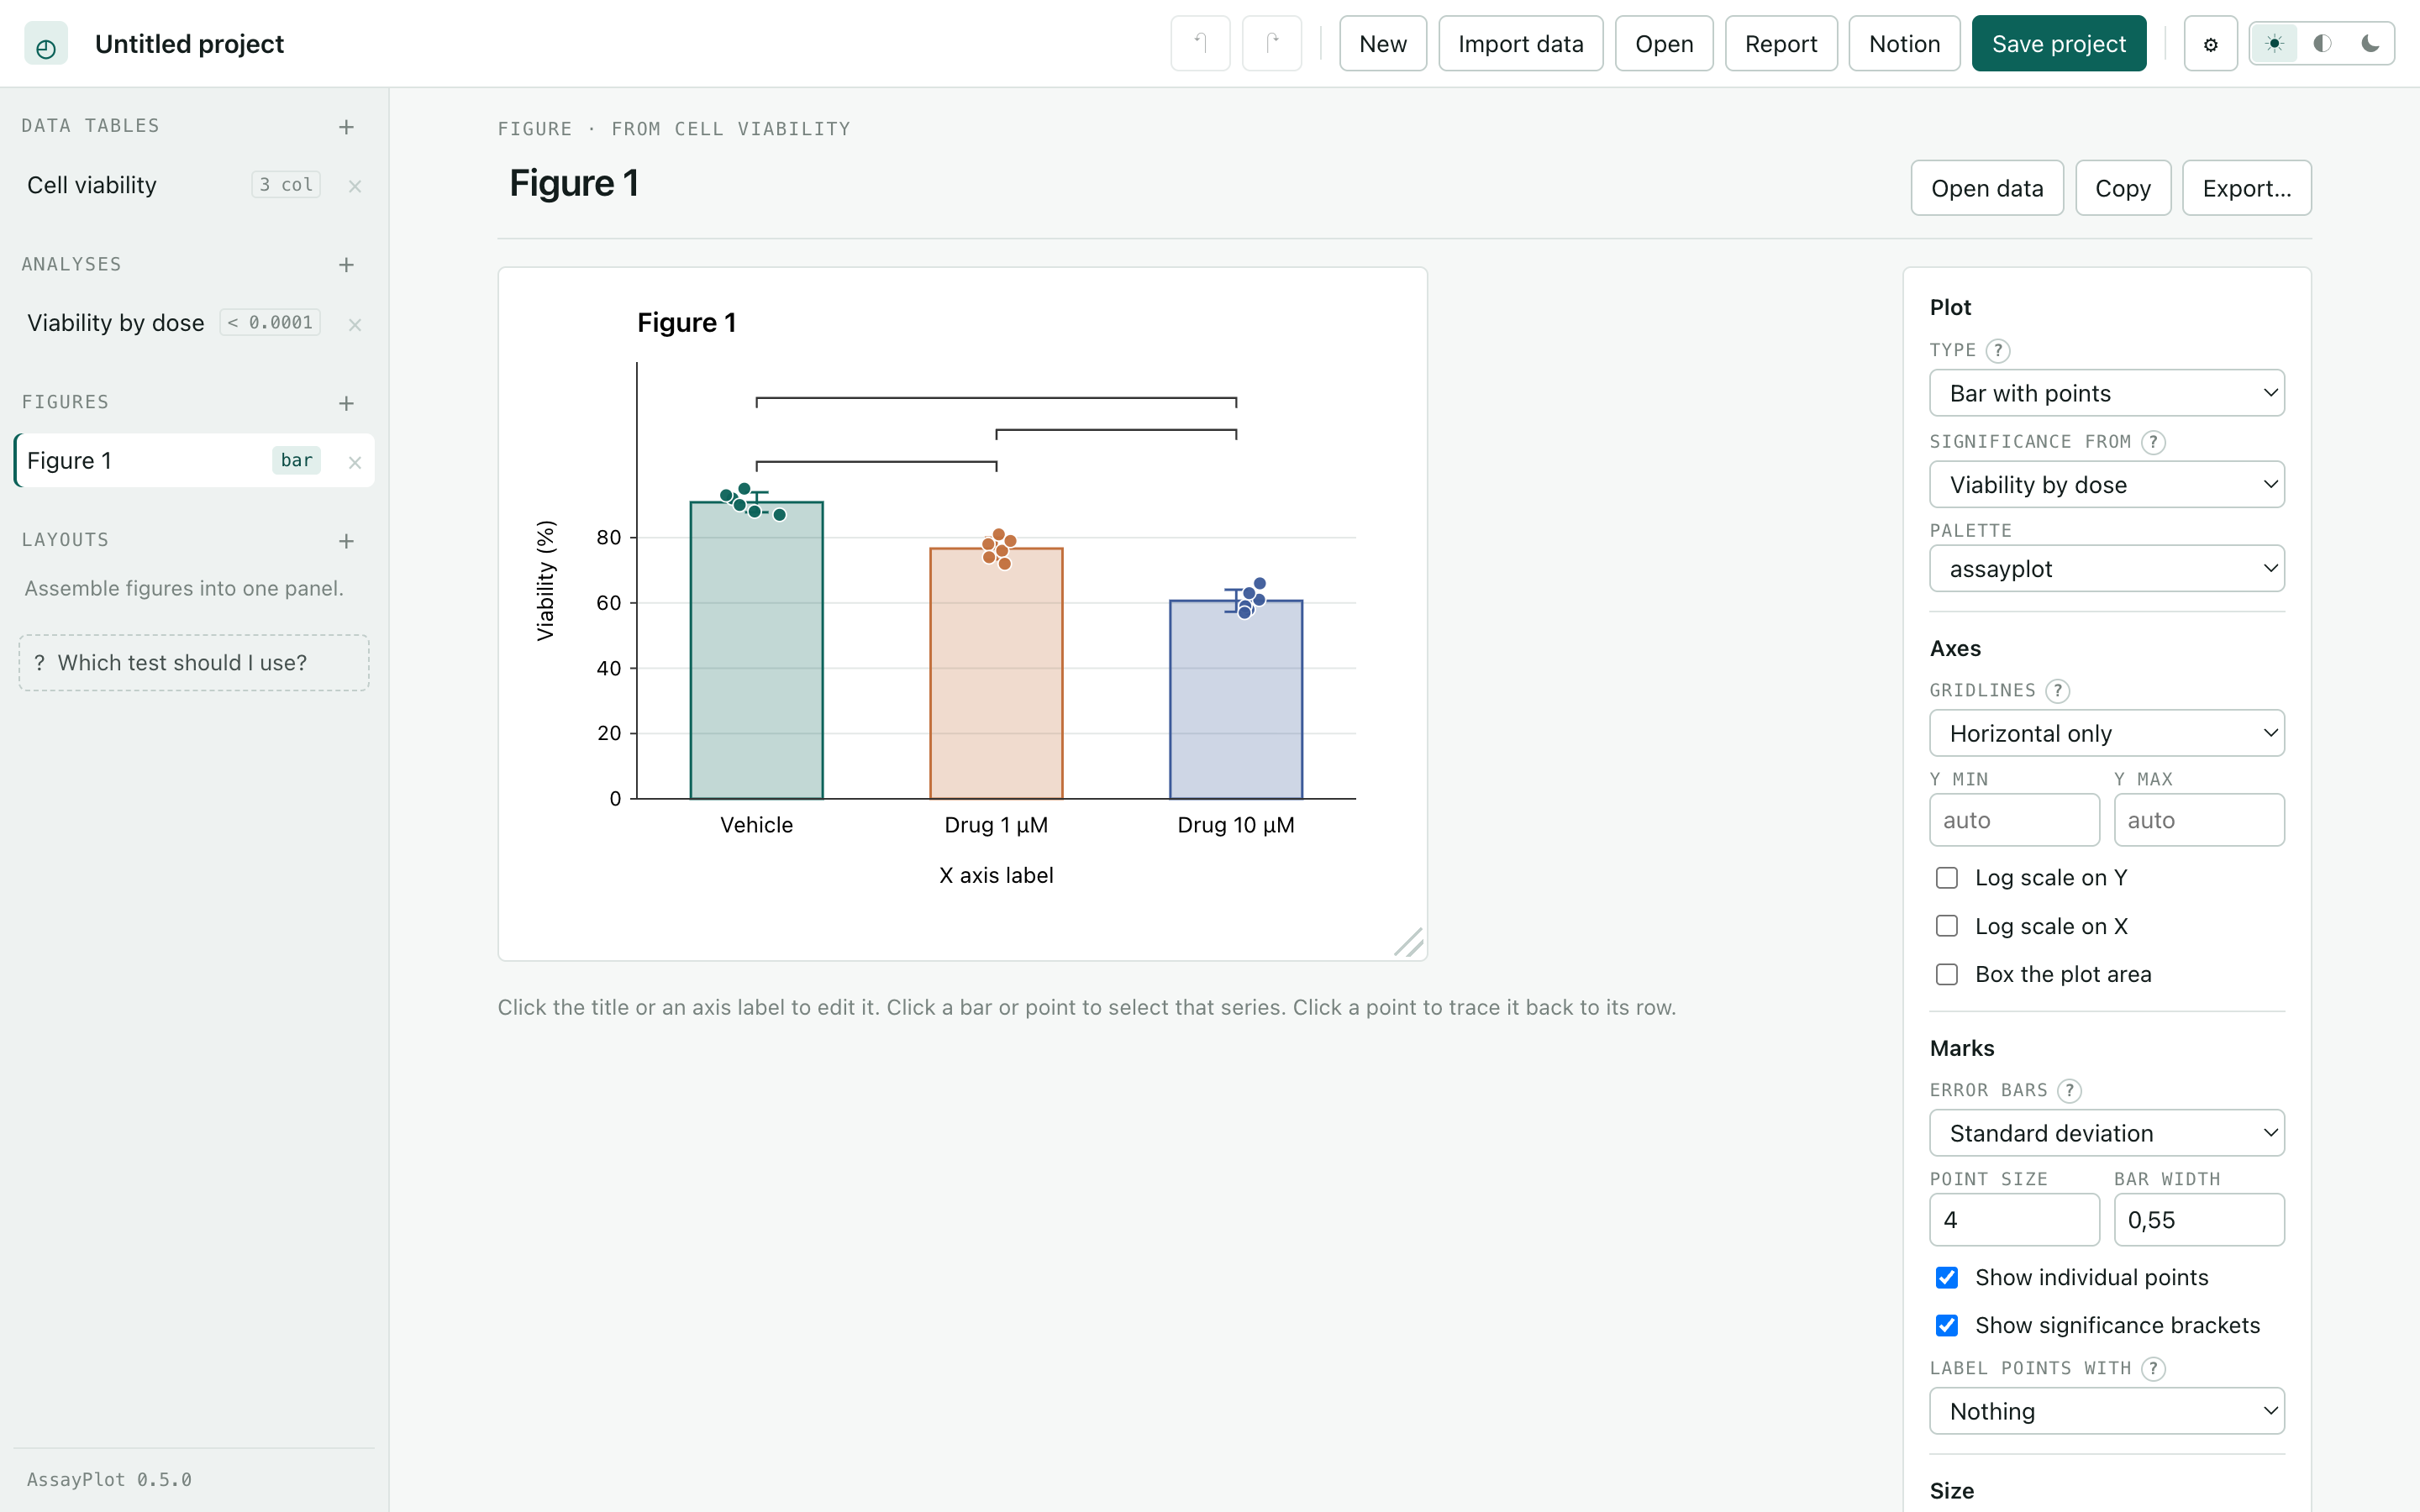
Get the data in, run a test that states what it assumes, build the figure, and export something a journal will take.
CSV, TSV, TXT, XLSX, XLS and ODS, several files at once, or pasted straight from Excel. The delimiter and the decimal separator are detected, so 1,5 written in Italy stays one and a half.
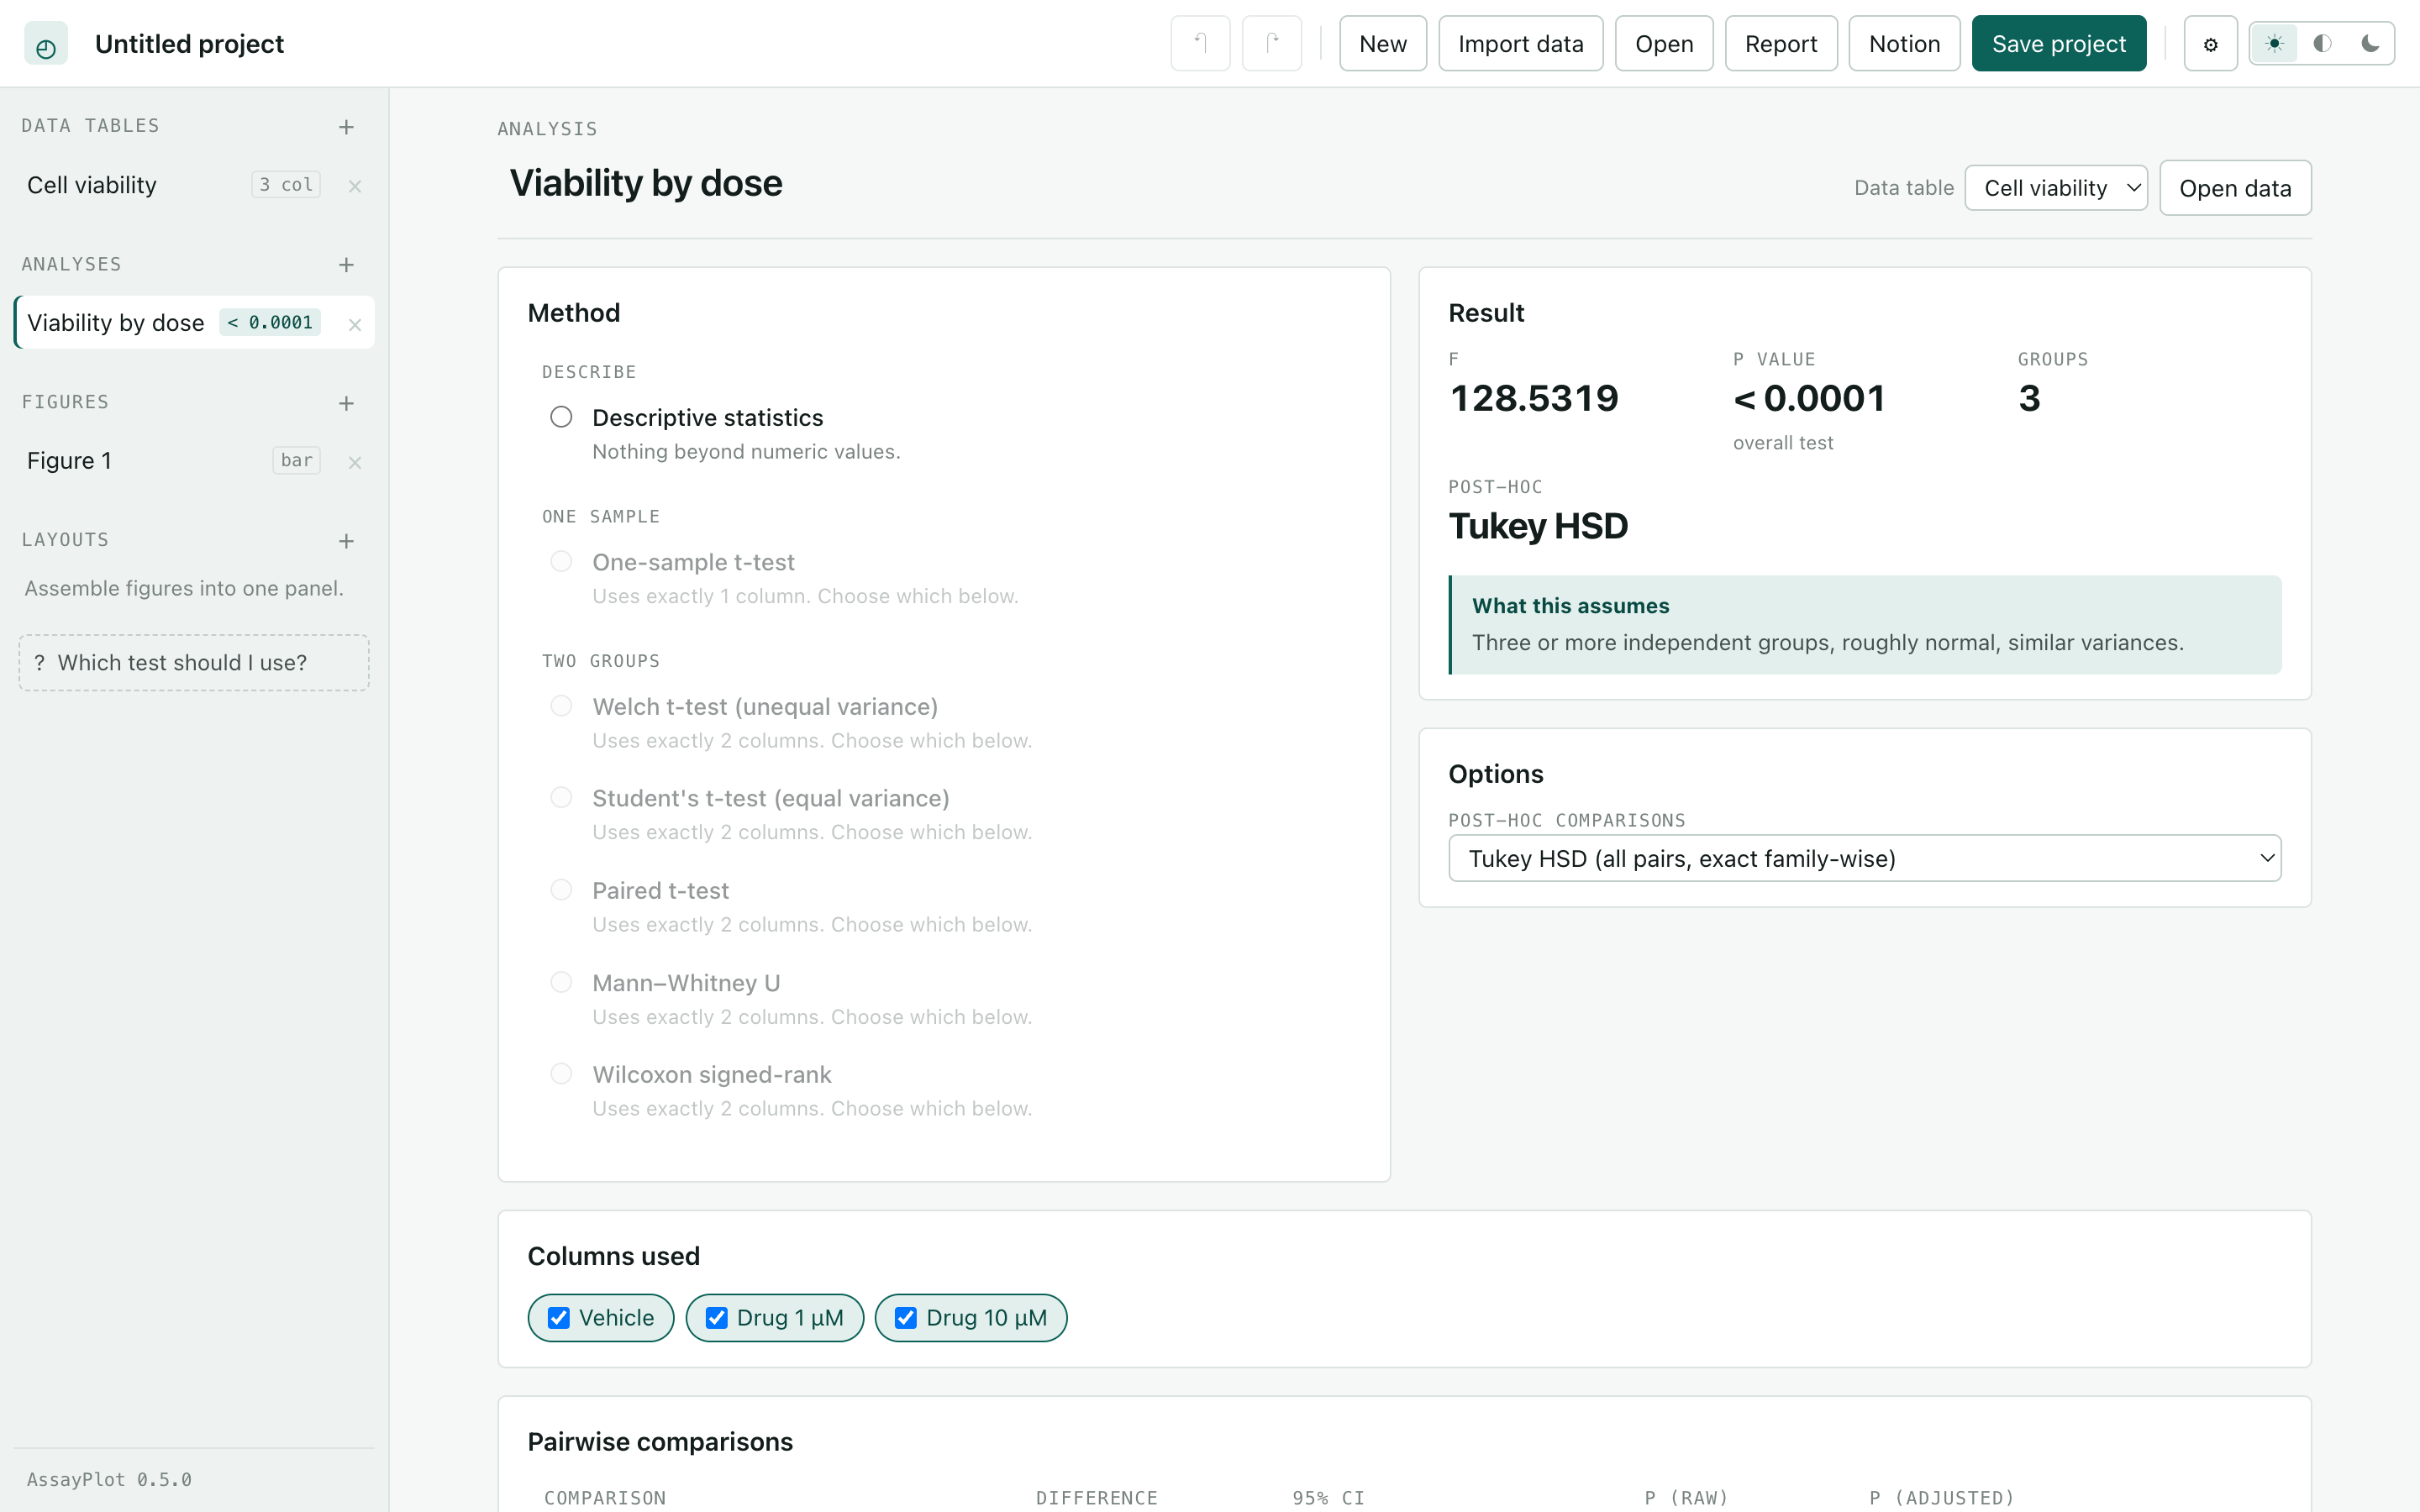
A method that cannot run on your table is greyed out with the reason. Every one states what it assumes before you commit to it. It will not pick a test for you.
Click the title and type over it. Click a bar to recolour that series. Drag the corner to resize. Gridlines, log axes, error bars and significance brackets are all yours.
SVG with live text, PNG at the resolution you choose, or PDF — saved wherever you point it, not into Downloads.
Every analysis writes a methods sentence for the manuscript. The report carries a SHA-256 of each data table, so a reviewer can confirm the numbers analysed were the numbers supplied.
No account, no telemetry, no upload. Projects are a ZIP of readable JSON — unzip one and read your numbers without AssayPlot installed.
Post-hoc comparisons are done properly: Tukey HSD with real family-wise confidence intervals, Dunn's test after Kruskal–Wallis, each group against a control, or Holm and Benjamini–Hochberg on plain pairwise tests.
| Comparing groups | Welch, Student and paired t-tests · Mann–Whitney · Wilcoxon signed-rank · one-way ANOVA · Kruskal–Wallis · Friedman · two-way ANOVA with replication |
|---|---|
| X versus Y | Pearson · Spearman · linear regression · dose–response with confidence intervals on every parameter and a test of whether the Hill slope was worth estimating |
| Survival | Kaplan–Meier with log-rank · Cox proportional hazards |
| Counts | Chi-square with Yates · Fisher's exact · McNemar · Mantel–Haenszel |
| Modelling | Logistic · Poisson · ANCOVA · mixed-effects models · generalised estimating equations |
| Multivariate | Principal components · hierarchical clustering with bootstrap support · ANOSIM · PLS-DA |
| Agreement | Cohen's kappa · Bland–Altman · TOST equivalence |
| Meta-analysis | Cochran's Q and I² |
| Genetics | Transmission disequilibrium · Mendelian randomisation |
| Study design | Simon's two-stage design · the resource equation |
| Assumptions | Shapiro–Wilk · D'Agostino–Pearson · Levene · Bartlett · Grubbs · ROUT |
Every procedure is checked against R on every test run. A script computes each one in R at full precision and writes the results to JSON; those fixtures are committed, so the suite runs anywhere Node runs. A second job regenerates them with R and fails if anything has drifted — which makes editing a fixture to force a pass impossible to hide.
Open it and start. Nothing else to install. After that it tells you when a new version is out and offers to fetch it.
| Your machine | File |
|---|---|
| Mac, Apple Silicon (M1 and later) | AssayPlot_x.y.z_aarch64.dmg |
| Mac, Intel | AssayPlot_x.y.z_x64.dmg |
| Windows | AssayPlot_x.y.z_x64-setup.exe |
| Linux, Debian or Ubuntu | AssayPlot_x.y.z_amd64.deb |
| Linux, anything else | AssayPlot_x.y.z_amd64.AppImage |
Nothing below the interface touches the DOM, which is why 256 tests run in Node in a few seconds.
npm install, then npm run dev for the browser or
npm run desktop:dev for the window. npm test runs the suite.
A statistical change needs a fixture proving it against R. A bug fix needs a test that fails without it.
AGPL-3.0-or-later. Use it, study it, change it, share it. Run a modified copy as a network service and you publish your changes.